|
AccuForm Formation / Floc Analyzer
Selected over Optest, M-B and others by major paper mills
+ Floc Size Distribution reported in ten size categories +
|
.
Features
· Industry standard single value FORMATION INDEX based on displayed optical basis weight histogram with approximately three times (3X) the sensitivity to changes in formation than others.
· Detailed FLOC and VOID ANALYSIS includes:
· Total Floc/Void Count
· Floc/Void Area (percentage)
· Average Floc/Void Size
· Floc/Void Average Intensity
· Displays and prints color Floc/Void contour maps
· Floc size distribution in 10 size ranges
· Clear and concise main user screen
· Save and retrieve all data and images, two click data saving to one of ten grades
· Graph utility for quick trend analysis
· Incorporates patented illumination technology
· Area light source is calibrated for uniformity and is compensated for more accurate measurement of light weight sheets
· Intense area light source penetrates heavy grades, automatic adjustment
· Optional paper drive for reel strip testing
· Calibration and repeatibility guaranteed to +/- 2%, (better than +/- 1% typical)
· Two year warranty on parts and labor
Applications
· Tissue to 500 gsm BW
· Provides quality control Formation Index plus Floc/Void analysis for wet end troubleshooting
Options
· Paper feeder for automatic profile testing
|
 |
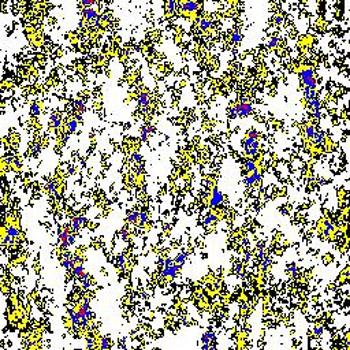
| Floc Image of bag paper |
|
Description The Formation / Floc Analyzer is a stand-alone instrument that provides both a single value industry standard Formation Index for routine production quality control testing and a separate Floc and Void Analysis that provides valuable information about the specific sheet formation properties. The instrument employs a uniformly calibrated area light source and an extremely high grade scientific camera to measure the variations in transmitted light due to variation of sheet densities.
The Floc Analysis gives a quantitative report of the sheet structure including the Total Floc Count, percentage of Floc Area, Average Size of the Flocs and an Average Intensity of the Flocs. The Average Intensity gives a measure of the Floc uniformity within the sheet. The instrument also performs an analysis on the light weight areas (Voids) of the sheet and produces the same information for the Void analysis. Floc Size Distribution is reported for ten different sizes ranging from 0.12 sq mm (0.4 mm) to 702.9 sq mm ( 30 mm) and above 702.9 sq mm.
The image to the left is a Floc contour map of bag paper, an example of the contour map that is automatically generated with each analysis. An option button allows for a Void contour map to be generated instead. Up to four colors (black, yellow, blue and red) may be used to display the levels of fiber density. Unlike a weather map with multiple shades of green for rain, the adjacent colors are chosen for high contrast to accentuate the levels of optical density. Black areas represent optical density just over the threshold (adjustable for further analysis). Red areas highlight the most intense flocs (or voids).
|
|
Formation Index Defined
A 10 x 10 cm area of a sample is scanned for variation in transmitted light. A total of 65,536 individual light intensity samples are used to build a histogram of samples vs. light intensity. The light intensities are grouped in up to 64 grayscale levels, or optical basis weight classes. The Formation Index is calculated by dividing the quantity of the most populated basis weight class (Peak Height) by the width of the histogram. The width of the histogram is the number of basis weight classes caused by the variation in optical density. Subtle changes in sheet formation and the respective histogram cause small changes in the Peak Height and the width of the histogram. The quotient of the two measures causes a multiplication effect that makes the resultant Formation Index very sensitive to sheet formation.
Floc Analysis Defined
A 10 x 10 cm area of a sample is scanned with 256 basis weight samples in each direction. The resultant pixel spacing is 0.4 mm in each direction. A Floc is defined as an area that is at least two basis weight classes above the mean class and has an area of at least 0.12 mm˛ (at least three contiguous pixels). The Floc structure of a sheet is a primary determinant of the surface structure and the respective quality of print and coating. The Floc/Void analysis may also be used to troubleshoot paper machines for quantitative comparison and trending of the paper structure on one particular machine or compared to others. The Floc structure in saturating grades represents the variation in take-up zones of the sheet.
User Screen
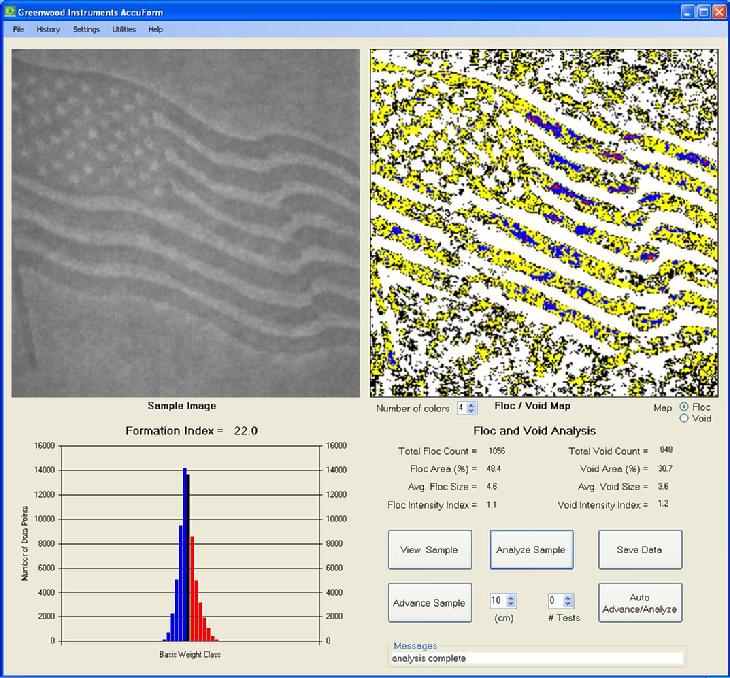
The image below is the main screen that shows the sample image (US Flag watermark in this case), a floc map of the sample, a histogram of the optical basis weight classes along with the resultant Formation Index, and the Floc and Void Analysis. The operation of the instrument is completely done by means of the very intuitive user screen and three small sub-screens. The sub-screens are: 1) Data Save - save data to one of ten grades (grades named by user), 2) Data History - graph the Formation Index for a chosen grade and 3) Floc (Void) Threshold adjustment - temporarily adjusts threshold to display and analyze more or less optically dense areas of a sheet. The threshold adjustment is very useful for the analysis of water marks.
|
 |
| Main Screen with US Flag watermark |
|
|
Images below:
US Flag watermark grayscale, floc map, floc map elevated threshold, void map
Manilla envelope grayscale, floc map, floc map elevated threshold, void map
Tennis raquets watermark grayscale, floc map, floc map elevated threshold, void map
Sailfish watermark grayscale, floc map, floc map elevated threshold, void map
|
Please send samples for testing:
Greenwood Instruments, LLC.
98 Greenwood Rd.
Andover, MA 01810
Ph: 978-470-3158
|
|
Copyright © 2022 Greenwood Instruments, LLC.
All Rights Reserved
|
|